Batch Analysis (Document Triage)
Batch Analysis projects are great for whenever a user is not sure what types of documents they have, and wants to perform identification and triage of documents before organizing them and sending them to a Contract Analysis project.
Clusters Tab
Clustering provides a visual aid for users who don’t yet know exactly what data they have in their documents, or even what kinds of documents they have. After uploading documents into a Batch Analysis, a user will be able to view the documents in that project arrayed as a series of clusters.
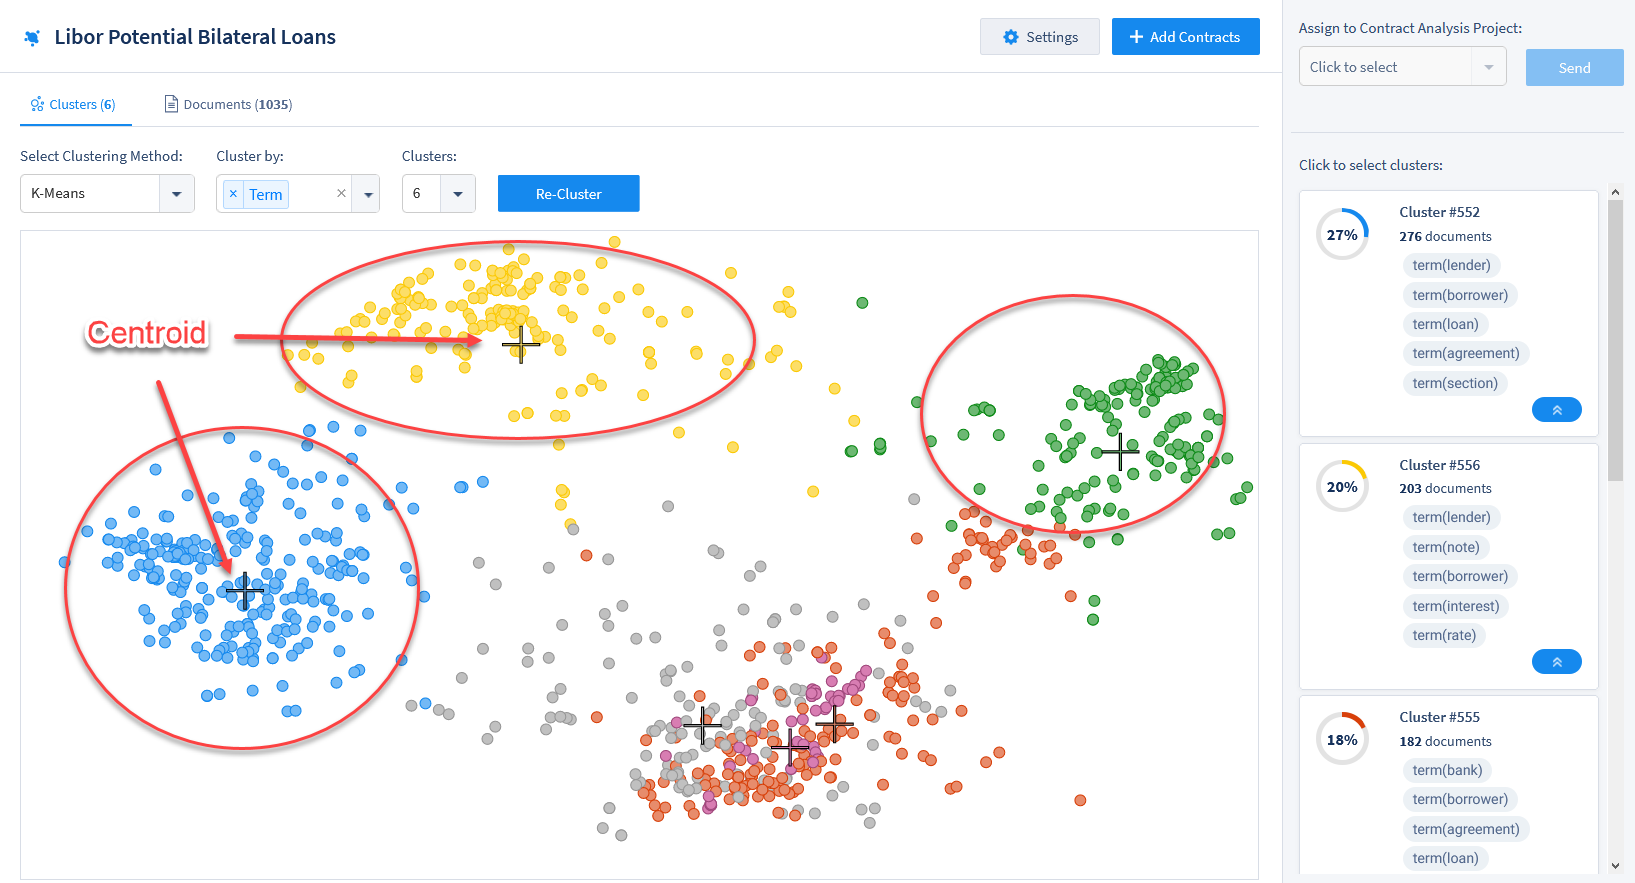
Each document is represented by a dot in the cluster array. Dots will appear in the same color if they are significantly related to others of the same color, based upon the Data Entity chosen in the “Cluster by” drop-down form. You can click any dot to open that document in the main viewing pane. The centroid cross within the cluster, meanwhile, represents the mathematical mean of the similar documents that have been clustered together. The following Data Entities can be chosen to cluster by:
Text
Term: Default. Clusters based on standard terms, or any Custom Term Sets used for the project.
Currency name (Dollars, Euros, Yen, etc.)
Currency value
Date
Definition: Clusters based on the defined terms found in documents.
Duration
Party: Clusters based on all named parties/companies/legal entities in documents.
Geoentity
You can also choose multiple Data Entities to further cluster your documents. To do this, select Data Entities from the “Cluster by” drop-down, and/or click the small “x” button to the left of a chosen Data Entity to remove it.
Controls for clustering:
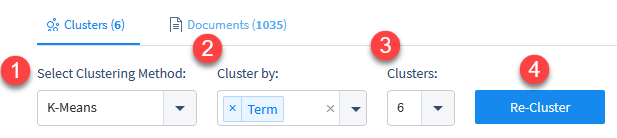
1. Select Clustering Method: There are three different mathematical methods users can implement for clustering. Each method provides a slightly different picture of the data. The outbound links listed here provide more information on these three clustering methods:
2. Cluster by: Choose which Data Entities to use for calculating clusters. You can select more than one Data Entity to produce more specific clusters. See above for the list of “Cluster by” options.
3. Clusters: Choose the number of clusters to be calculated. Each cluster will be assigned a different color. Changing this setting can be especially useful if you know, for example, that you have documents from four separate countries, or that you have three different types of documents, or that you have eight different clients. This is also important when choosing how and where to send clusters to Contract Analysis projects.
4. Cluster/Re-Cluster: Click this button to re-cluster documents after changing your settings. This may take a second, or close to a minute, depending on how many documents are in your Batch project.
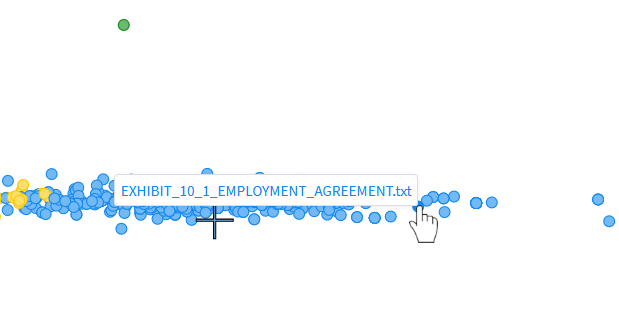
You can open any document directly from the Clusters tab by clicking a dot.
Editing Cluster Properties
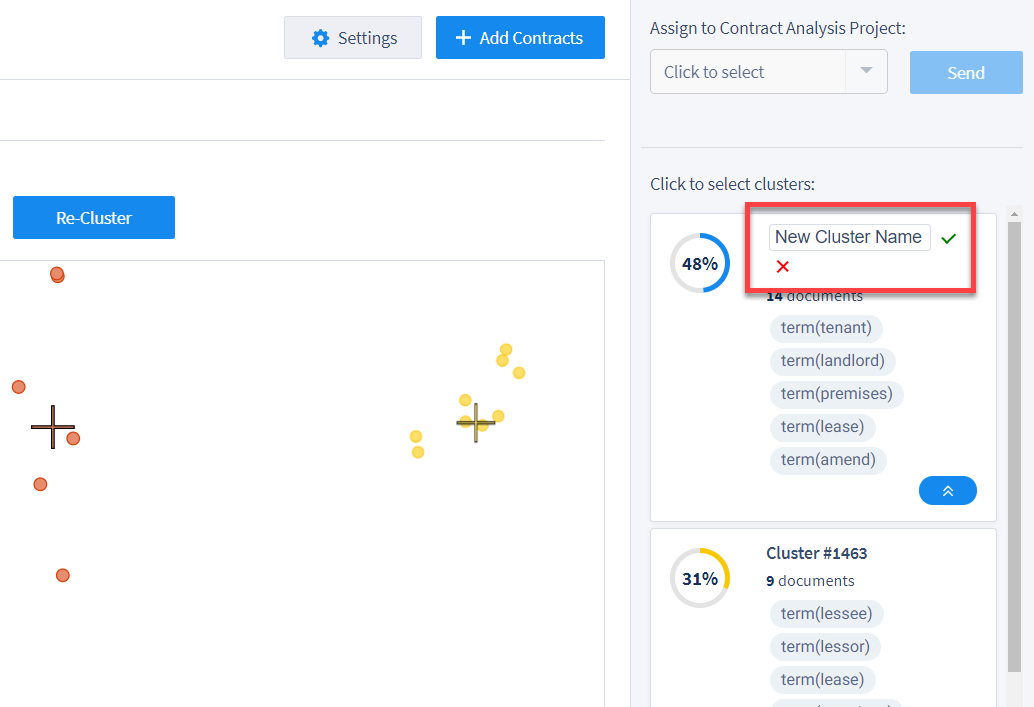
Once your documents are clustered the way you want, you can rename clusters by clicking the cluster name, or the “edit” icon, in the right pane.
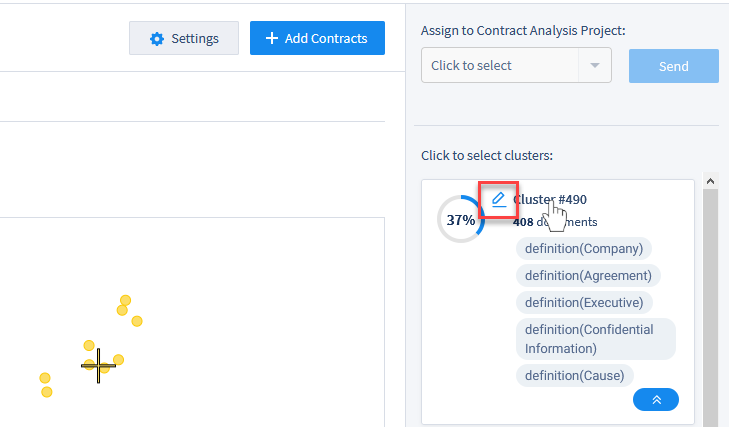
Enter a new name for the cluster and click the green “checkmark” (or click the red “x” to revert).
Sending Clusters to Contract Analysis Projects
After clustering your documents, you can easily send an entire cluster to an already existing Contract Analysis project. Find the cluster you want to send, and click on it. A blue border will appear around that cluster’s information.
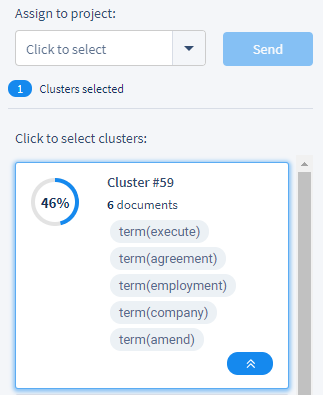
Next, use the drop-down menu at the top right of the screen (top center, above) that says, “Click to select”. All Contract Analysis projects that you have access to will be listed in the drop-down. Select the cluster you wish to send, and click “Send” to send those documents from the Batch Analysis and into the chosen Contract Analysis project for more in-depth review and training.
Once your Contract Analysis project has all the documents you want to send to it from the Batch Analysis, you can start reviewing those documents.
Documents Tab
Clicking the “Documents” tab in the top left of a Batch Analysis Project will take you to the Document Grid View.
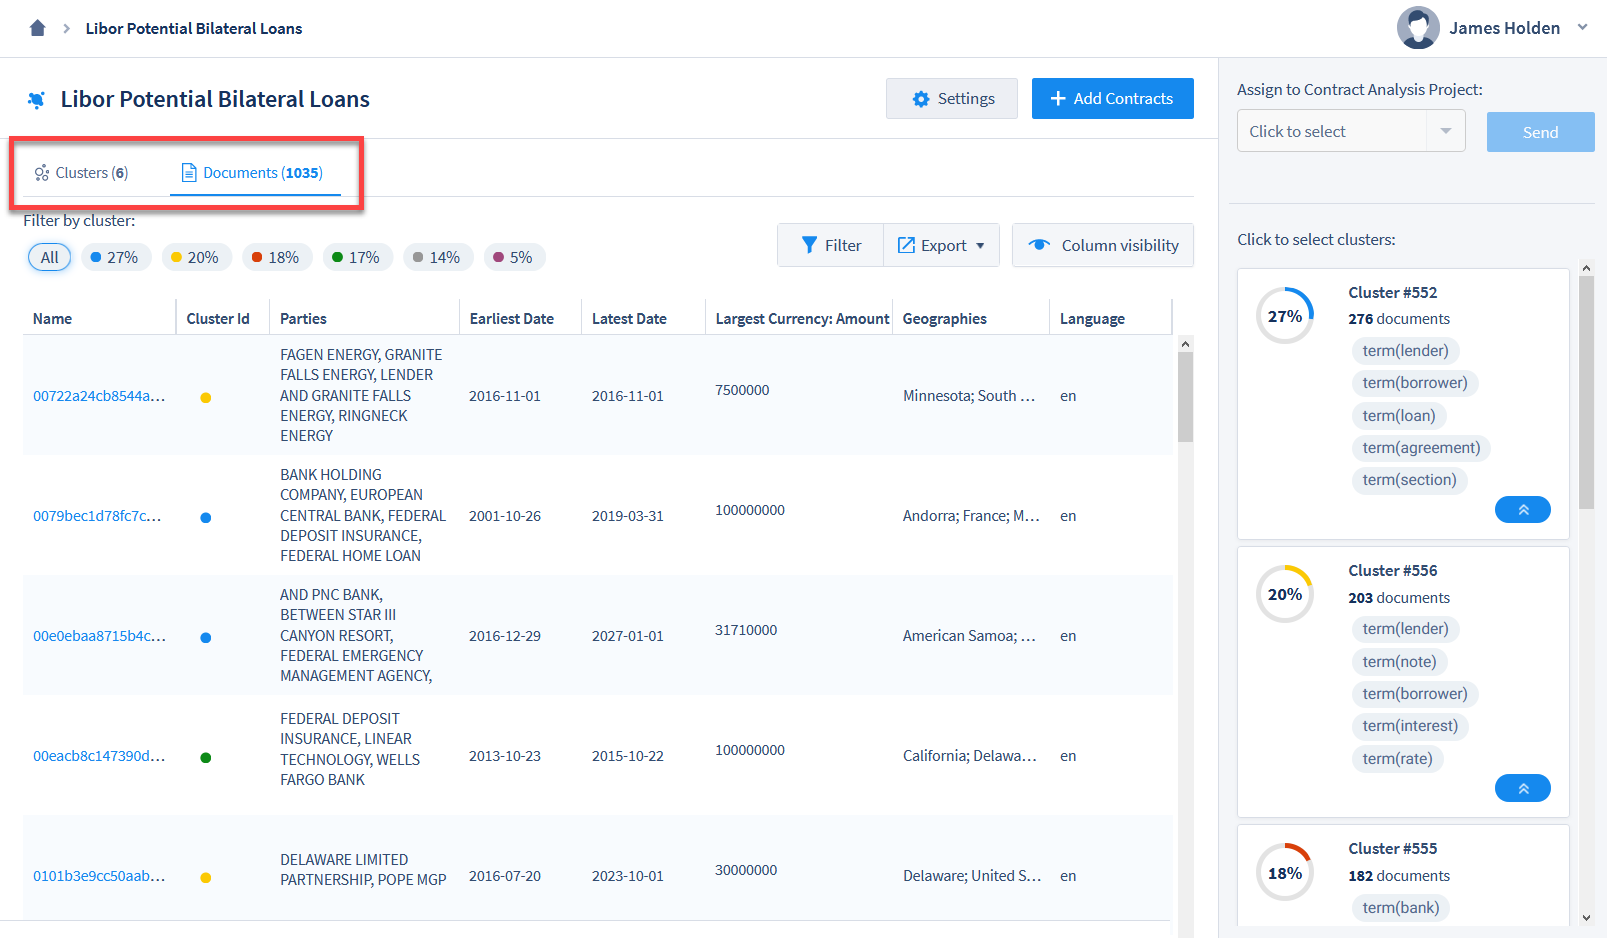
Documents are listed in the Grid with different columns representing Data Entities, including a column for Cluster ID with a matching colored circle. In the top right of the Documents Grid, there are several options for customizing the Grid.
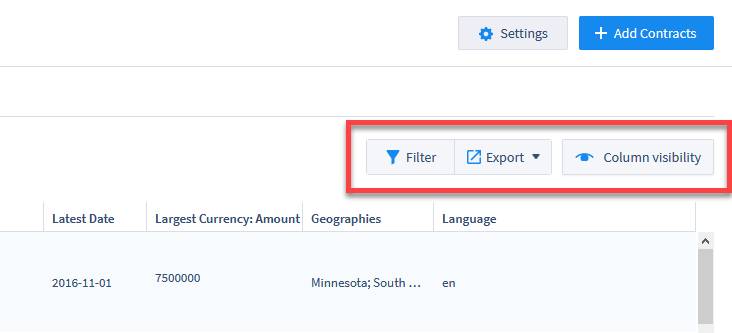
Filter: This option allows you to filter the Documents Grid using individual searches in any of the visible columns. For example, typing “< 5000000” in a Currency Field will show only those documents that have extracted currency values of under 5,000,000. Use in combination with Column Visibility to conduct targeted searches within an entire project.
Export: You can export a spreadsheet of all the data contained in the Documents Grid, based on which Filters and Columns you’ve chosen to display. There are 3 export options:
Microsoft Excel 2007-2013 XML (.xslx)
Text CSV (.csv)
Export Selected Cluster(s) (.zip): Export selected documents into a
.zipfolder.
Column Visibility: Change which Fields are visible in the Documents Grid. Use in combination with Filters to conduct targeted searches within an entire project. The following columns are selectable for all Batch Analysis projects, in the “Default Fields” or “Additional Fields” section of the Column Visibility pop-up:
Name
Cluster ID
Title
Is Contract
Parties
Earliest Date
Latest Date
Largest Currency: Amount
Document ID
Definitions
Currency Types
Geographies
OCR Rating
Folder
Language
Original Doc Link
Contract Type
Contract Type Top 3
Load Date
Loaded By
Annotator
Clicking on a document’s name in the Batch Documents Grid will open that document in the Annotator. The document’s text is displayed, with passages of text highlighted based on standard extracted Data Entities. Many of these Data Entities are also available as clustering options:
Citations (under development)
Currencies
Dates
Date durations
Definitions
Geographies
Parties
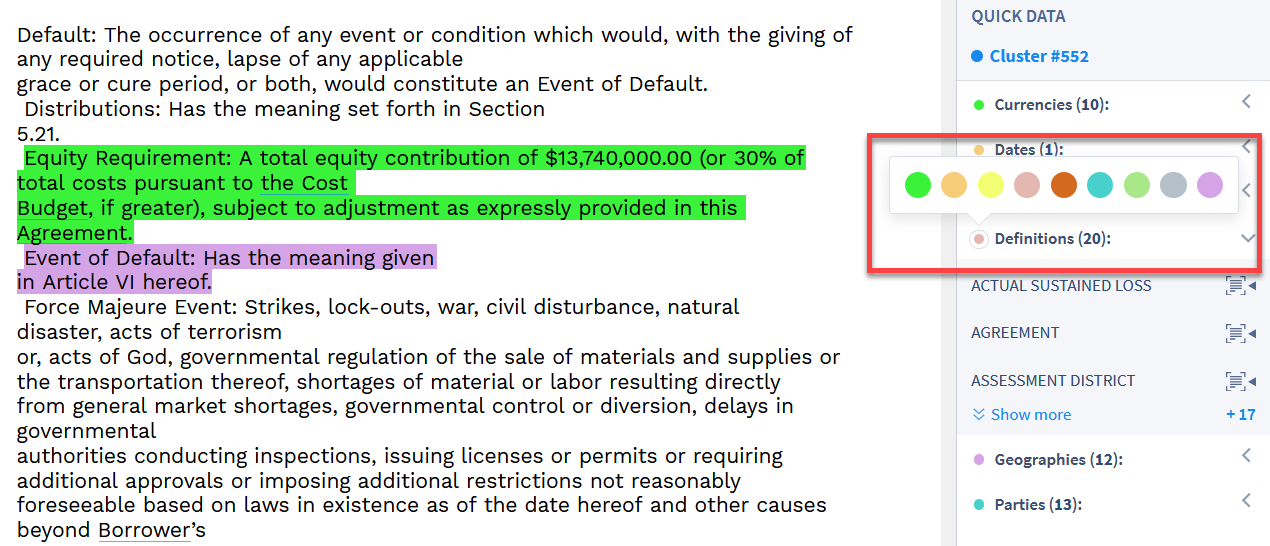
The Annotator displays the highlighted text from which ContraxSuite has automatically extracted these standard Data Entities. The blue highlights in the main pane show where the data was found in the document, while the index on the right pane shows which Fields extracted the data. The image below shows a document in the Batch Annotator.
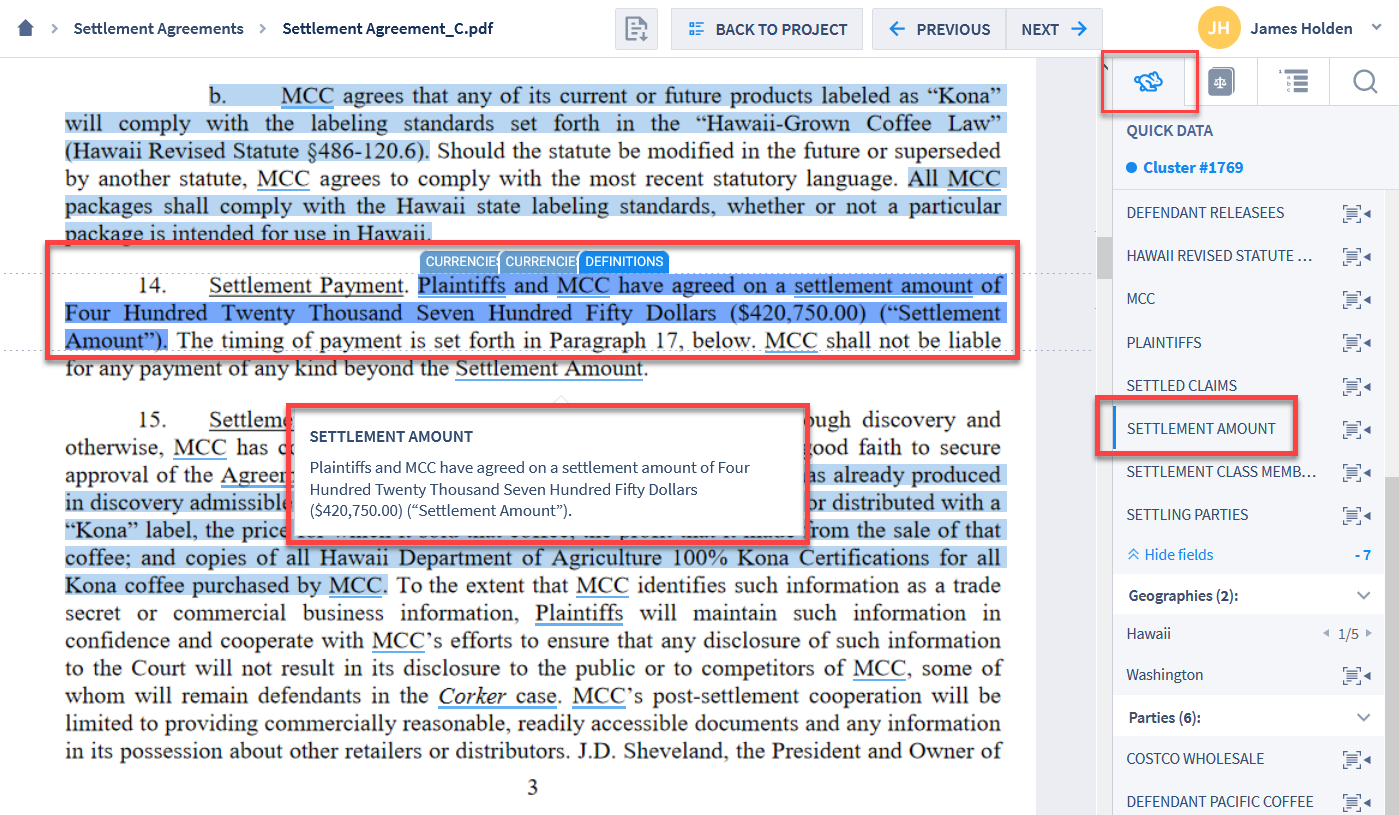
In the top right, the Batch Annotator screen defaults to showing “Quick Data” in the right pane. The “Quick Data” pane contains an index of the Data Entities listed above. Clicking on a term with a blue underline will open a pop-up displaying the Definition of that term.
Viewing Tabs
There are four main viewing tabs in the right pane of the Batch Analysis screen:

1. Quick Data: Default. This is an index of standard Data Entities in the document:
Citations (under development)
Currencies
Dates
Definitions
Durations
Geographies
Parties
2. Definitions: This tab displays a list of defined terms within a document, extracted from the structure of the document. This includes any internal lists of definitions contained within the document itself. These definitions can also be viewed within the Main Annotator Pane, by clicking the blue line underneath any instance of that defined term.
3. Section Navigation: This tab displays a document’s internal sections and sub-sections. Users can quickly navigate to different sections in the document by clicking on a section or sub-section in this list.
4. Search: This tab allows users to conduct a simple search within the document for specific words or phrases.
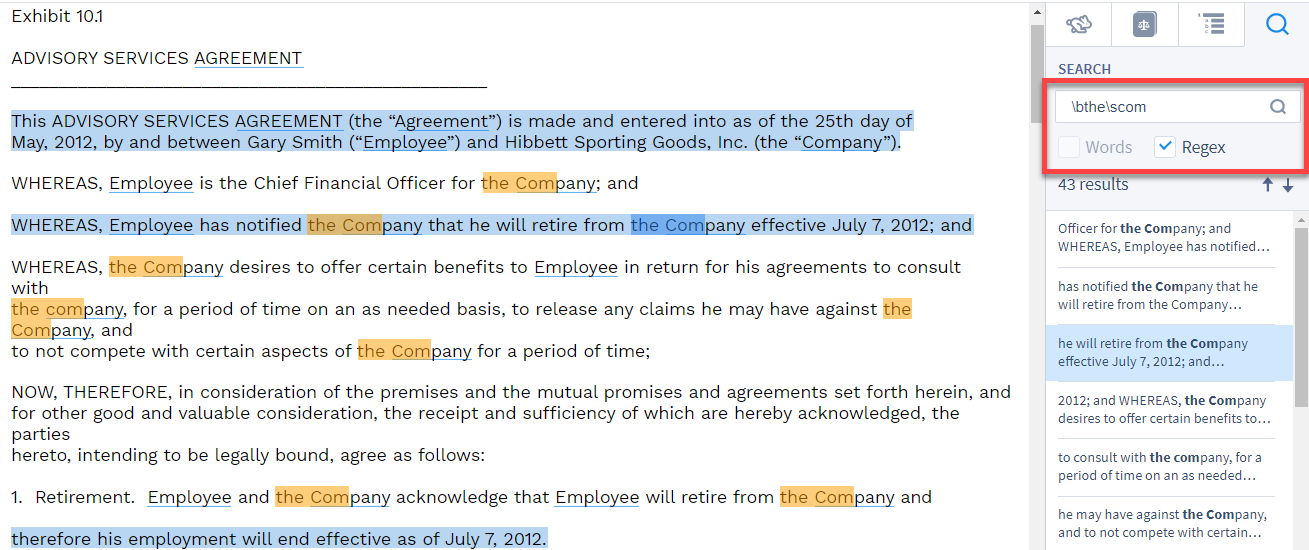
Users can choose to search via regular text, or via regular expressions, by clicking the respective checkboxes (see image above).
Display Options Panel
At the bottom right of the Annotator pane, there is a Display Options Panel:
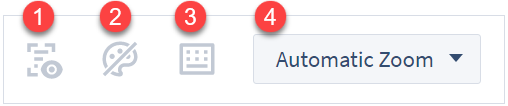
1. Text Highlights On/Off: By default, users will see highlights in the Annotator for any text unit that has a value extracted from it. If you wish to hide these highlights for all of the text in the document, click this icon to toggle highlights on or off.
2. Color-Coded Entities On/Off: Enable or disable color-coding of Data Entities.
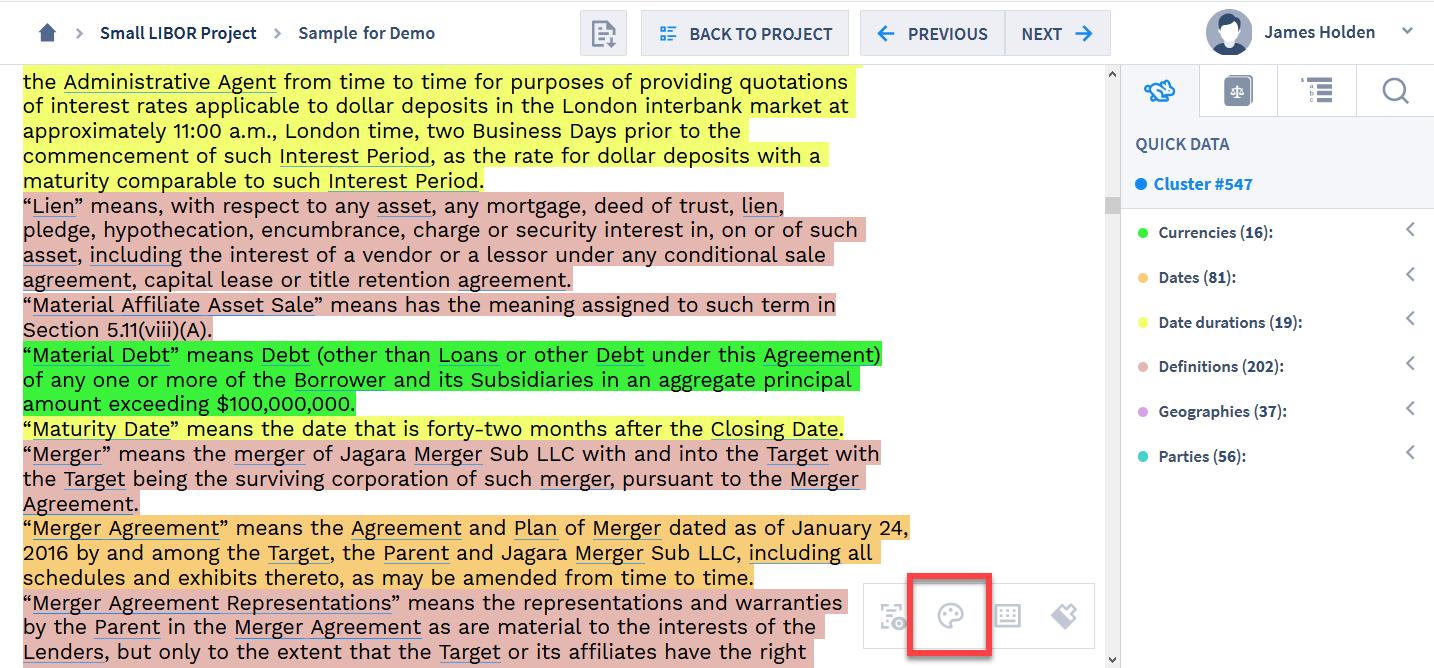
Each color is assigned by default, but you can change the color associated with a Data Entity by hovering over the color circle next to the Data Entity in the Quick Data tab of the right pane.
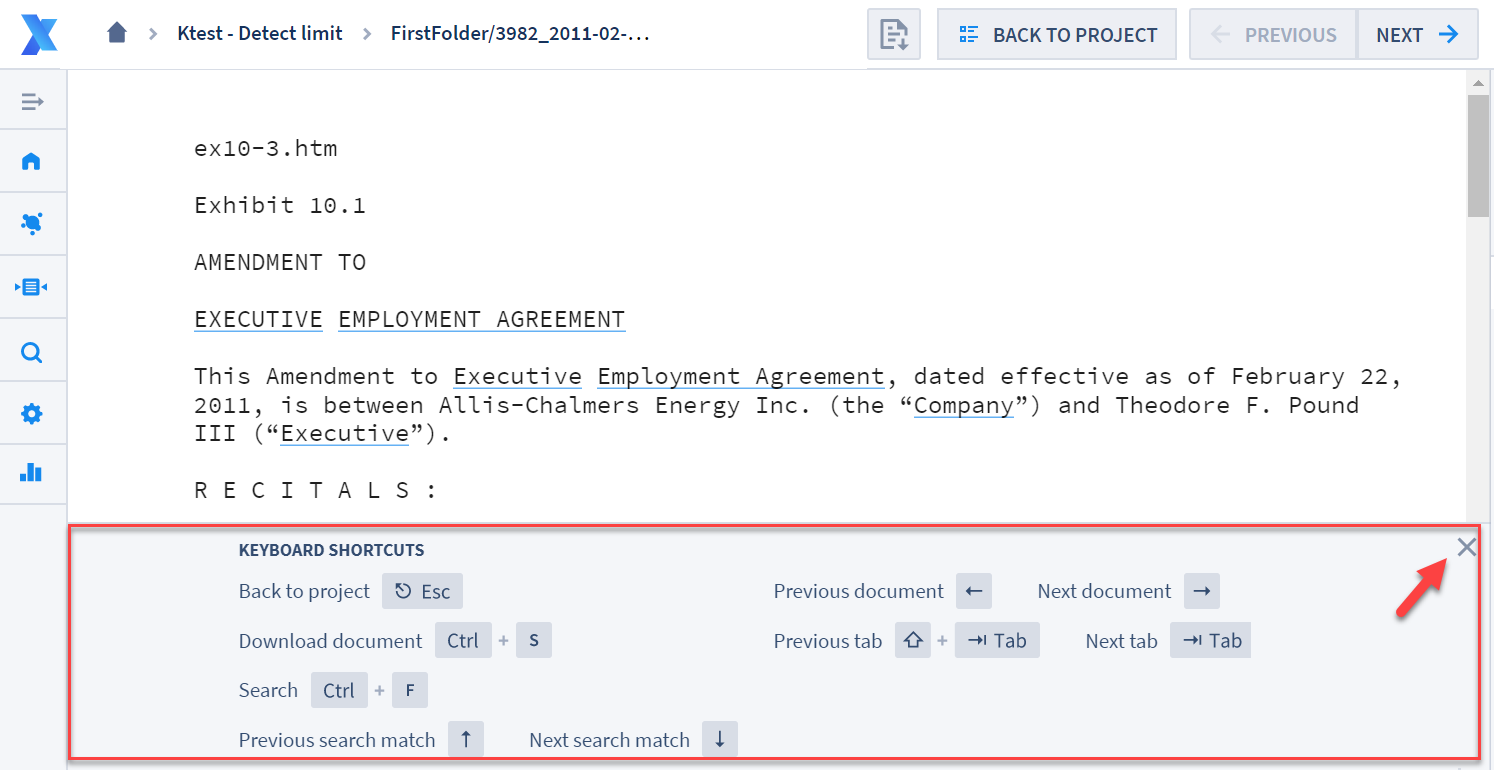
3. Keyboard Shortcuts On/Off: Click this icon to show a list of keyboard shortcuts available in the Batch Annotator. To hide this panel, click the “X” in the upper right corner.
4. Annotator Zoom: Click this icon to display a pop-up list of zoom options:
Automatic Zoom. Default
Actual Size
Page Fit
Page Width
Page Height
50%
75%
100%
125%
150%
200%
Click the “Next” button below for instructions on how to use the Contract Analysis project interface.